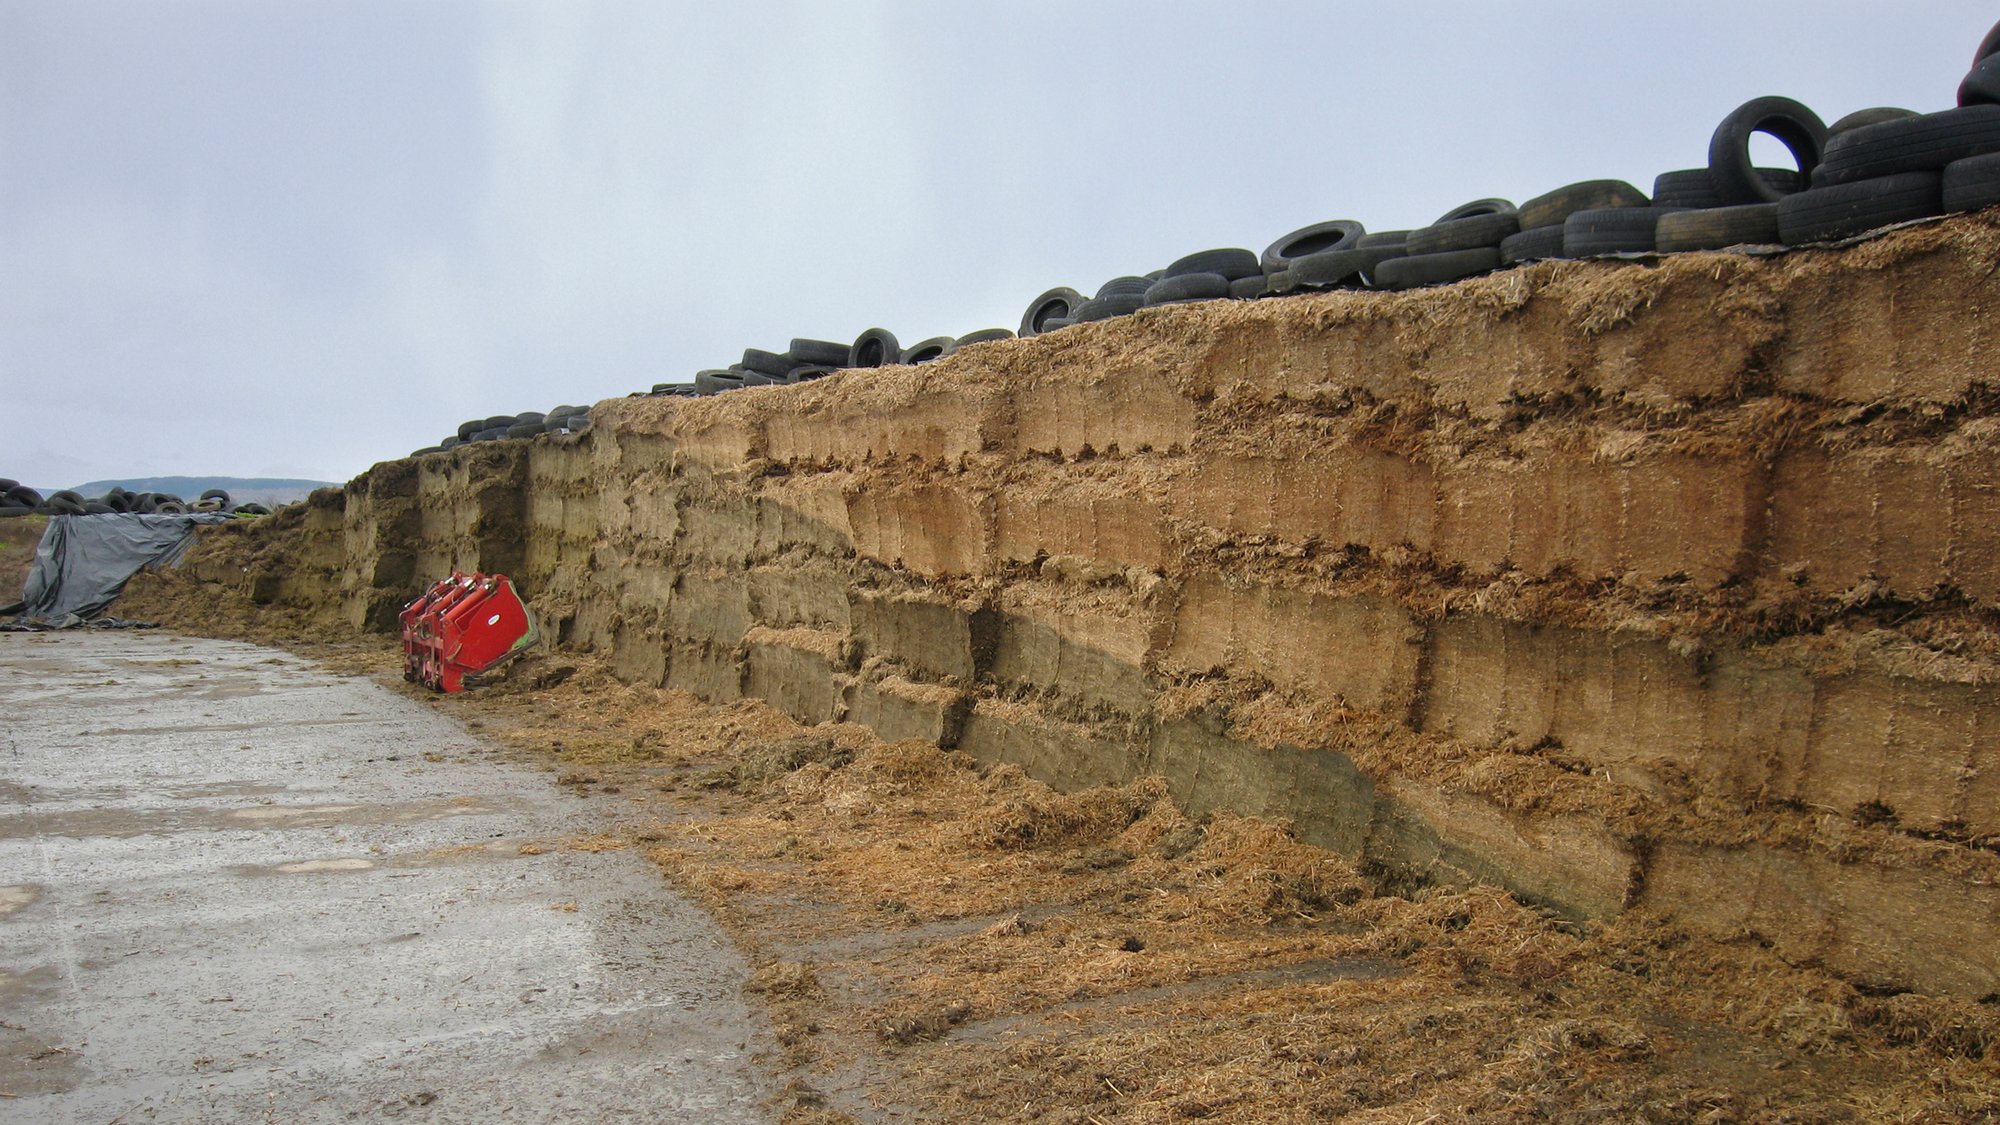
Multiple factors determine fermentation quality including:
-
Moisture
-
Sugar content
-
Naturally-occurring bacteria
-
Added inoculants
-
Packing density
-
Particle size
-
Temperature
A Fermentation Profile can reveal:
-
How well these factors worked together during ensiling
-
Which areas can be improved
-
How fermentation end products affect animal performance
-
Whether added inoculants have the desired effect
Fermentation Quality Analysis

VFA Complete Profile (Chemistry)
Includes 12 markers of fermentation quality:
- Volatile fatty acids: lactic, acetic, propionic, butyric, iso-butyric
- Alcohols: propanediol, ethanol, methanol, propanol, butanol
- pH and ammonia
Mold & Yeast Count
Includes a count of colony-forming units of yeast and mold per gram of silage. Higher counts indicate lower aerobic stability.

Markers of fermentation quality are unstable (volatile fatty acids). Special care should be taken to ensure that the sample tested at the lab is representative of the silage stored on the farm.
Consider using one or more of these strategies to improve sample integrity during transport to the lab:
-
Use expedited delivery options, such as delivering samples directly to the lab or utilizing overnight shipping.
-
Vacuum-seal. Inexpensive Food Saver™ or Ziploc™ sealing systems work well for excluding oxygen to preserve silage.
-
Keep the sample cool! Freezing samples can lower the number of viable spores. Include cold packs in shipments while avoiding direct contact with the sample.
-
When shipping cold or frozen samples, use insulated shipping containers to avoid damage to the packaging from condensation.
Choose a Package
Ship With Care
Legume & Mixed Silage
| Moisture | 65% | 50-65% | <50% |
| pH | 4.0-4.3 | 4.3-4.7 | 4.7-5.0 |
| Lactic acid | 6.0-8.0 | 4.0-6.0 | .0-4.0 |
| Acetic acid* | 1.0-3.0 | 0.5-2.5 | 0.5-2.0 |
| Propionic acid | <0.5 | <0.25 | <0.1 |
| Butyric acid | <0.5 | <0.25 | <0.1 |
| Iso-butyric acid | <0.1 | <0.1 | <0.1 |
| Ethanol | <1.0 | <1.0 | <0.5 |
| Methanol | <0.5 | <0.5 | <0.5 |
| 2-butanol | <0.5 | <0.5 | <0.5 |
| 1-propanol | 0.5-1.5 | 0.5-1.5 | 0.5-1.5 |
| 1,2 propanediol** | 0-3.0 | 0-3.0 | 0-3.0 |
| Ammonia (% of CP) | <15.0 | <12.0 | <10.0 |
| Lactic:acetic ratio | 2+ | 2/5+ | 2.5+ |
| Lactic (% of total acids) | 60+ | 70+ | 70+ |
Grass Silage
| Moisture | <70% |
| pH | 4.3-4.7 |
| Lactic acid | 6.0-10.0 |
| Acetic acid* | 1.0-3.0 |
| Propionic acid | <0.1 |
| Butyric acid | <0.1 |
| Iso-butyric acid | <0.1 |
| Ethanol | <1.0 |
| Methanol | <0.5 |
| 2-butanol | <0.5 |
| 1-propanol | 0.5-1.5 |
| 1,2 propanediol** | 0-3.0 |
| Ammonia (% of CP) | <12.0 |
| Lactic:acetic ratio | 2+ |
| Lactic (% of total acids) | 60+ |
Corn Silage
| Moisture | 60-65% |
| pH | 3.8-4.2 |
| Lactic acid | 5.0-10.0 |
| Acetic acid* | 1.0-3.0 |
| Propionic acid | <0.1 |
| Butyric acid | <0.1 |
| Iso-butyric acid | <0.1 |
| Ethanol | <3.0 |
| Methanol | <0.5 |
| 2-butanol | <0.5 |
| 1-propanol | 0.5-1.5 |
| 1,2 propanediol** | 0-3.0 |
| Ammonia (% of CP) | <8.0 |
| Lactic:acetic ratio | 3+ |
| Lactic (% of total acids) | 70+ |
High Moisture Corn
| Moisture | 25-30% |
| pH | 4.0-4.5 |
| Lactic acid | 1.0-2.0 |
| Acetic acid* | <0.5 |
| Propionic acid | <0.1 |
| Butyric acid | <0.1 |
| Iso-butyric acid | <0.1 |
| Ethanol | <2.0 |
| Methanol | <0.5 |
| 2-butanol | <0.5 |
| 1-propanol | 0.5-1.5 |
| 1,2 propanediol** | 0-3.0 |
| Ammonia (% of CP) | <10.0 |
| Lactic:acetic ratio | 3+ |
| Lactic (% of total acids) | 70+ |
Source:
1) Limin Kung Jr., University of Delaware - personal communication
2) Richard E. Much, U.S. Dairy Forage Research Center, Madison, WI - personal communication
Note: Target levels represent naturally fermented silages or silages treated with fermentation aids such as microbial inoculants and/or enzymes.
*Forages inoculated with Lactobacillus buchneri products may result in higher than normal concentrations of acetic acid. Research shows the increased levels do not result in poor fermentations or negative effects on animal intake.
**1,2 Propanediol is typically <0.25% but can be as high as 3.0% in silages inoculated with Lactobacillus buchneri.
TESTING SERVICES
Dairy & Beef Nutrition
Mill Quality Assurance
Hay Testing
Water
Forage Superbowl
© 2024 Dairyland Laboratories, Inc.
SUPPORT SERVICES
Affiliate Labs
R & D
Portable NIR
NIR Packages


